Use Case: Review And Get Data from a Hand-Drawn Chart
Table of Contents
- Step 1: Open the Envelopes inbox.
- Step 2: Upload the chart.
- Step 3: Open the chart.
- Step 4: Pick the chart-reading checklist.
- Step 5: Run the review.
- Step 6: Read the extracted points.
- Step 7: Open the envelope menu.
- Step 8: Insert a sample script.
- Step 9: Read the rolled-up values.
- Conclusion
- What You Learned
Extract Data from a Hand-Drawn Chart
This use case demonstrates how to extract data from a hand-drawn chart. You will upload a chart image into Revdoku, run an AI checklist to read every data point, then use a built-in script to deduplicate and list the extracted values.
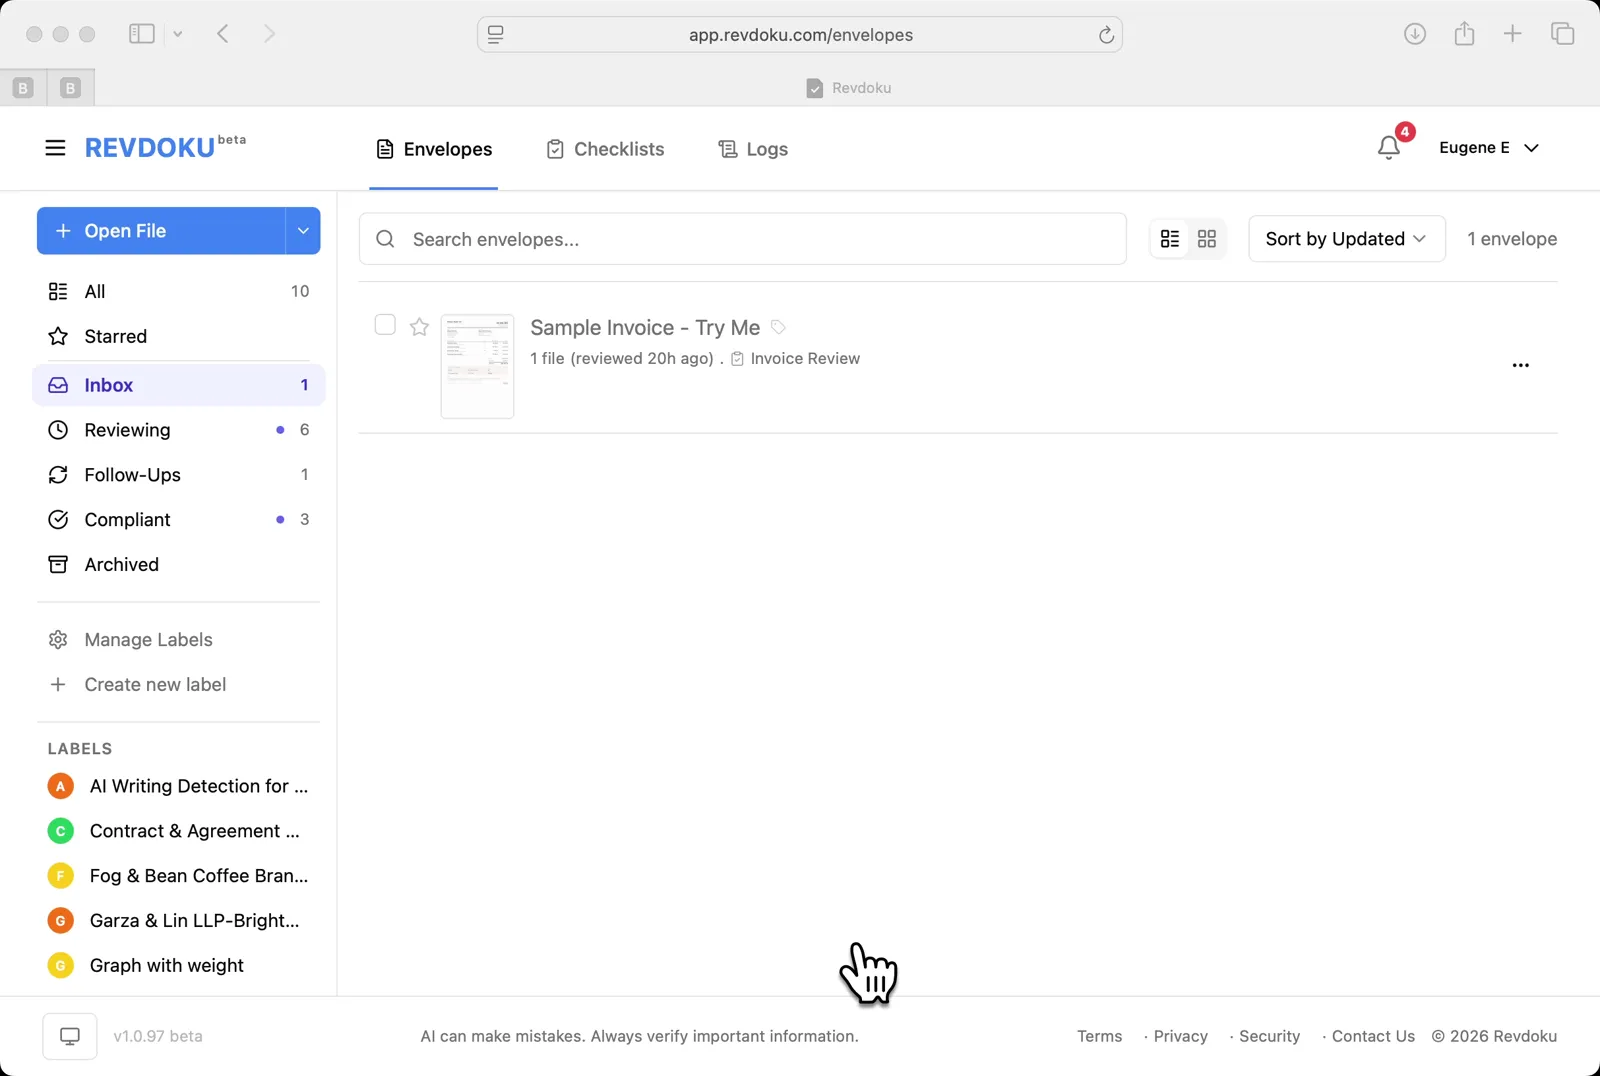
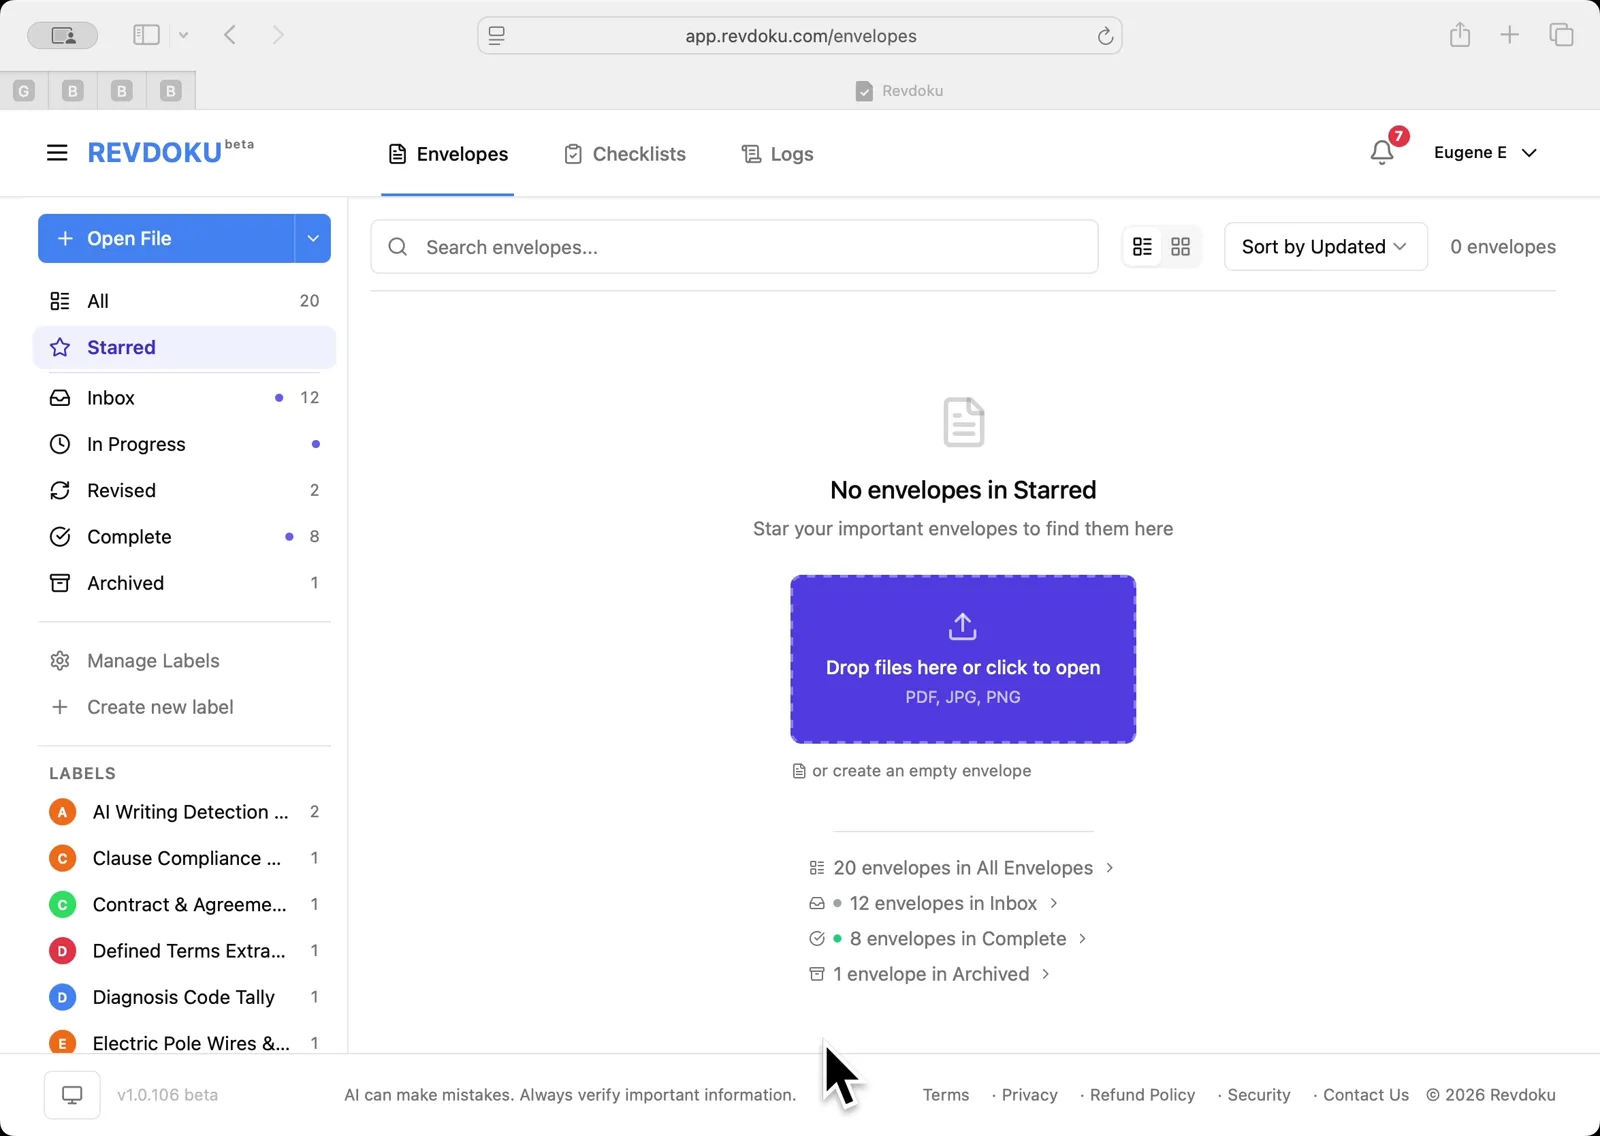
Step 1: Open the Envelopes inbox.
Open the Envelopes inbox. The inbox lists the documents available for review.
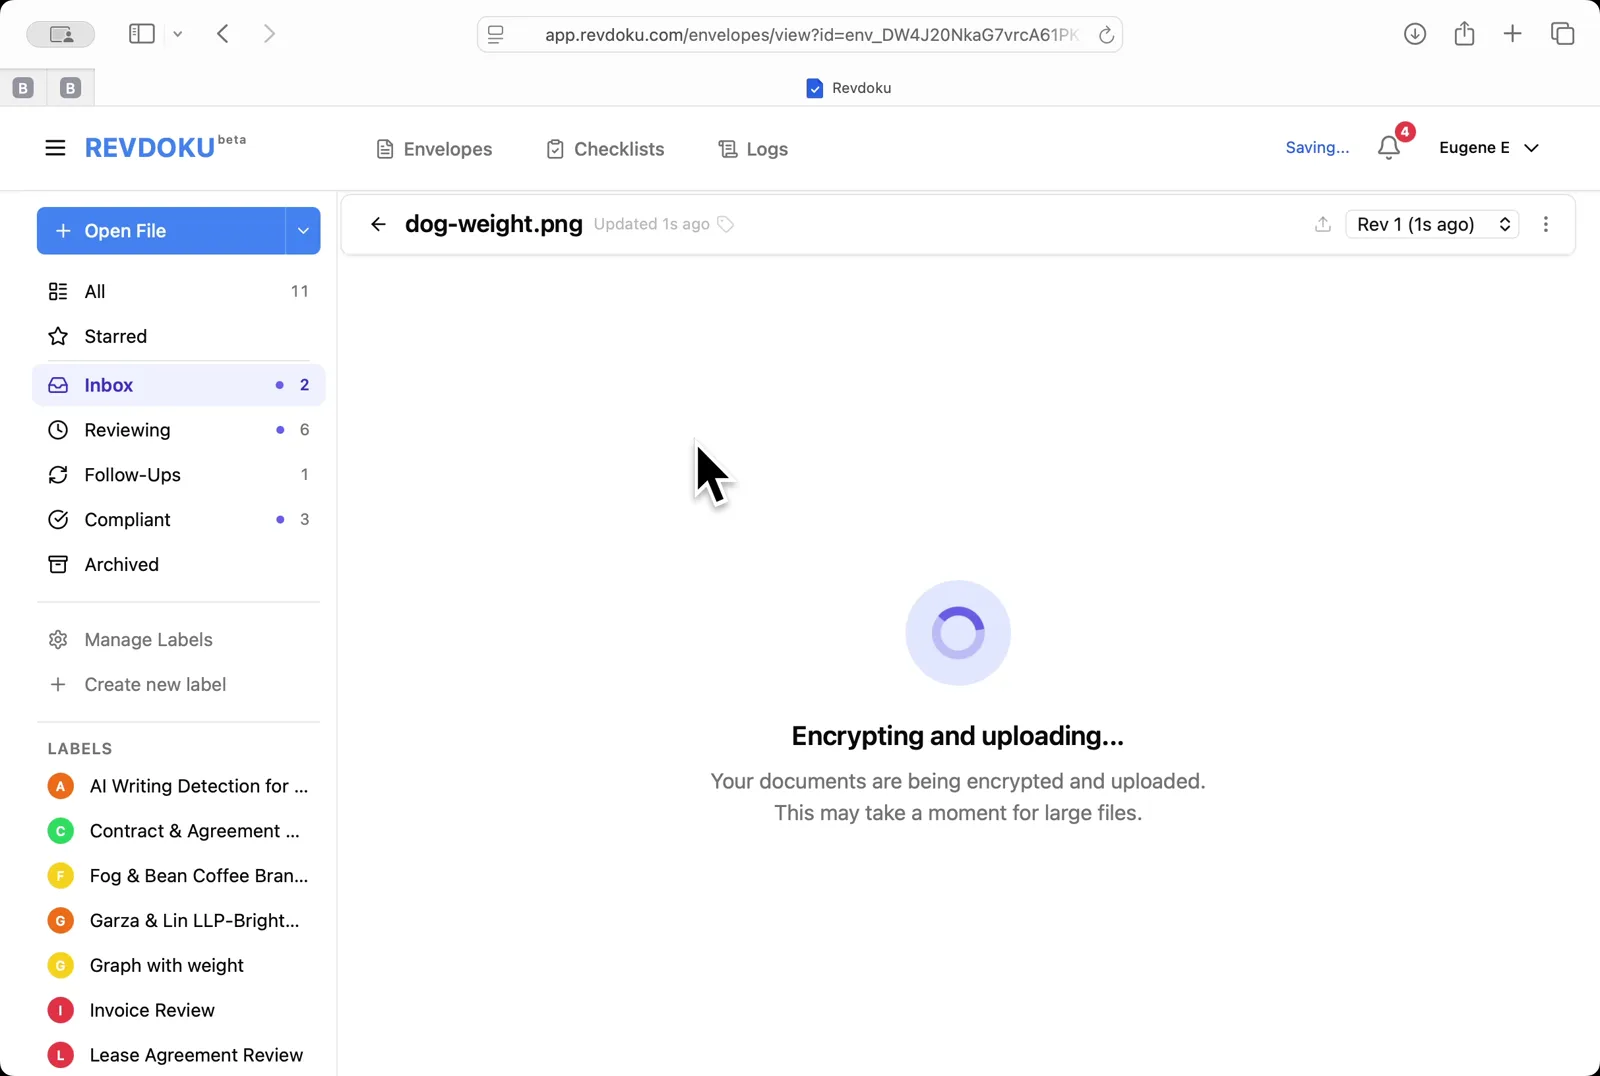
Step 2: Upload the chart.
Upload the chart. Click Open File and pick dog-weight.png; Revdoku encrypts and uploads the image.
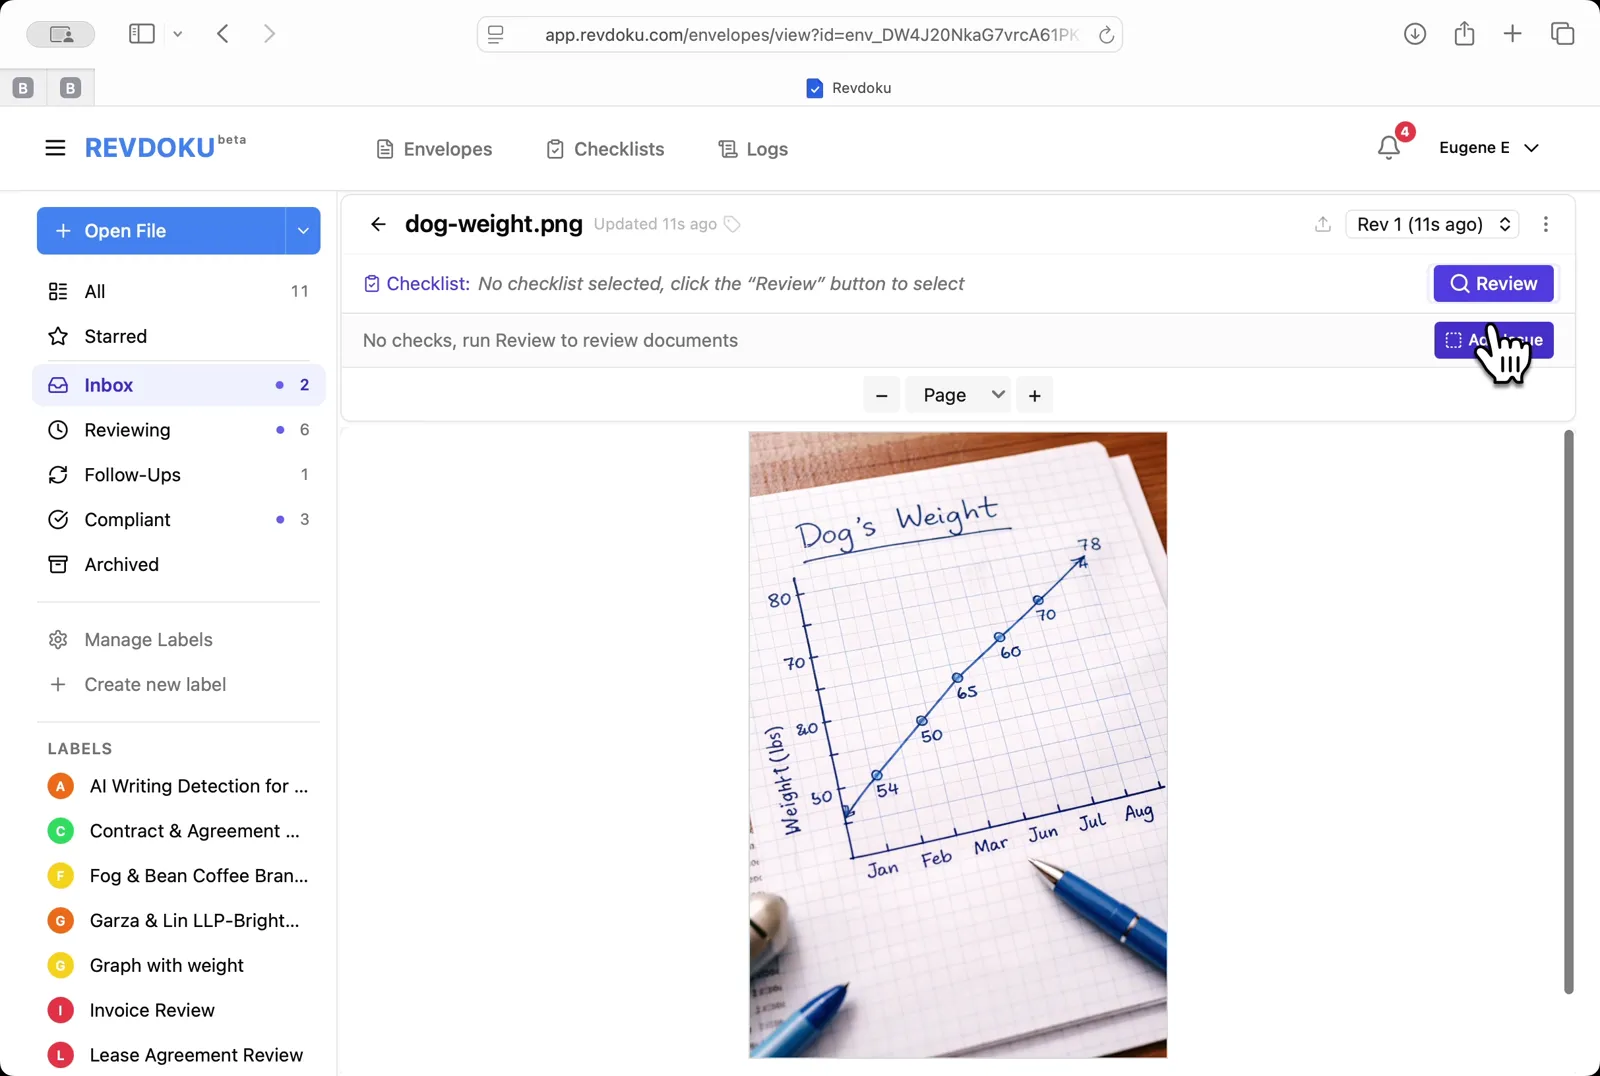
Step 3: Open the chart.
Open the chart. The viewer shows a hand-drawn Dog’s Weight line chart with monthly points from January to August.
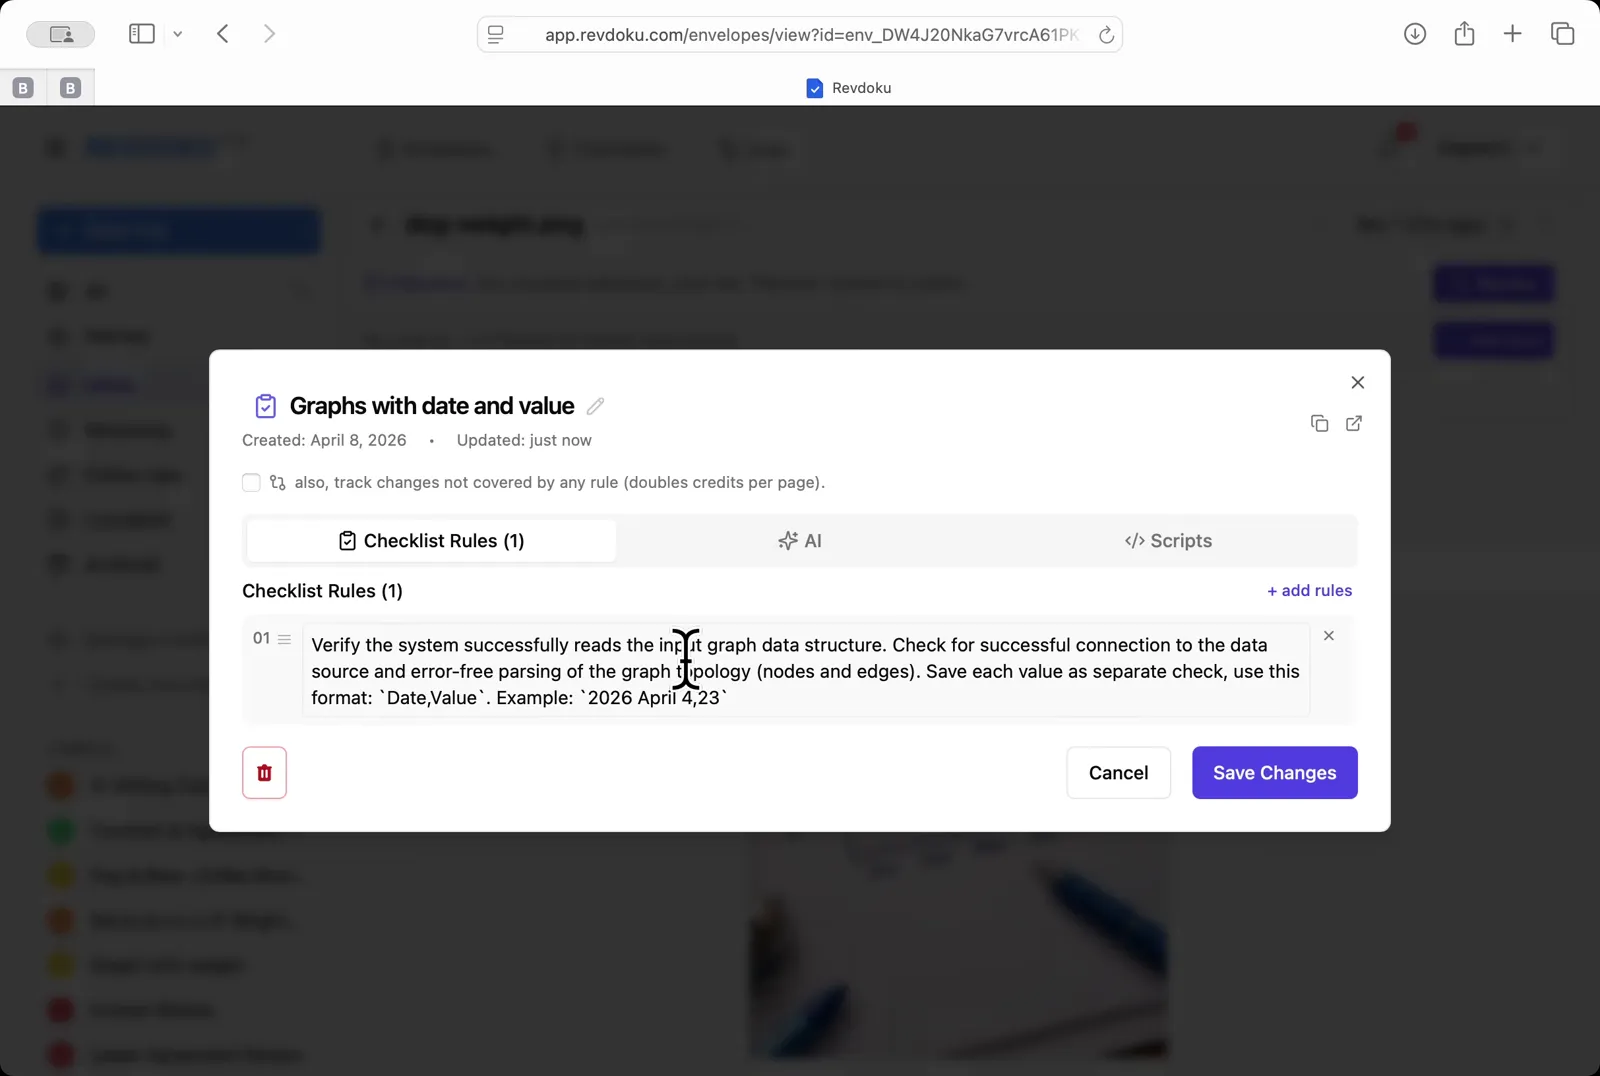
Step 4: Pick the chart-reading checklist.
Pick the chart-reading checklist. Choose Graphs with date and value — a one-rule checklist that asks the AI to extract every Date, Value pair.
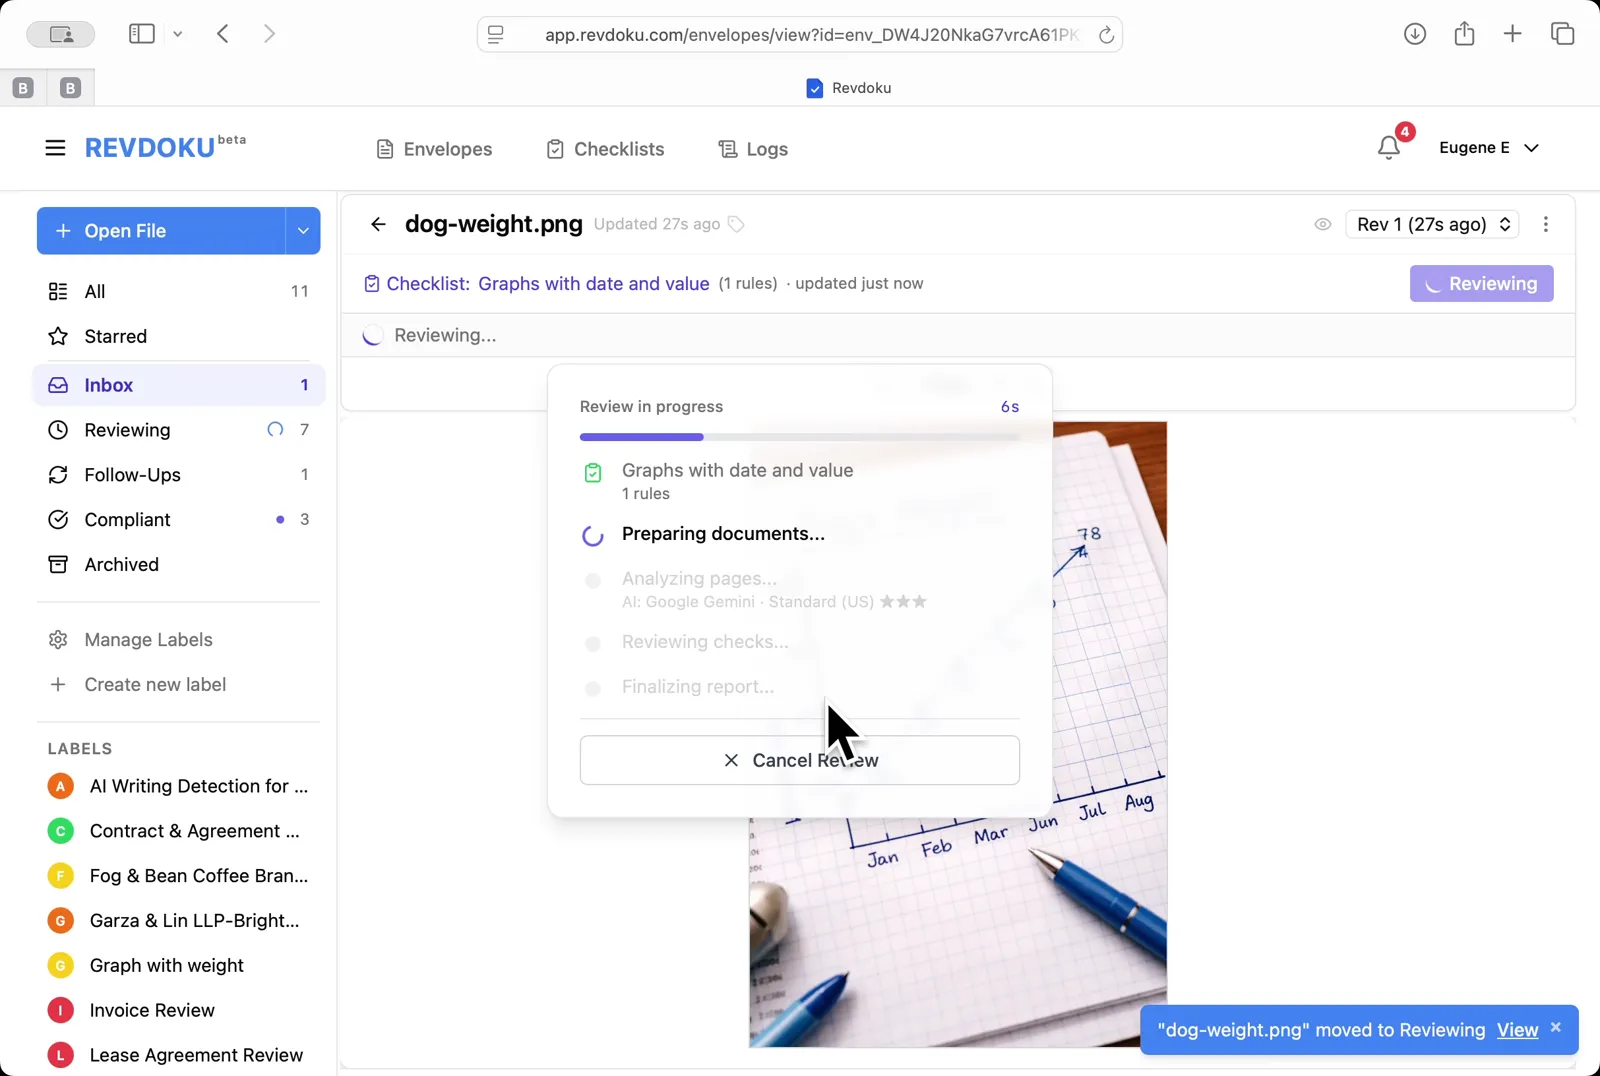
Step 5: Run the review.
Run the review. Click Review and Revdoku analyzes the page with Google Gemini and runs the rule.
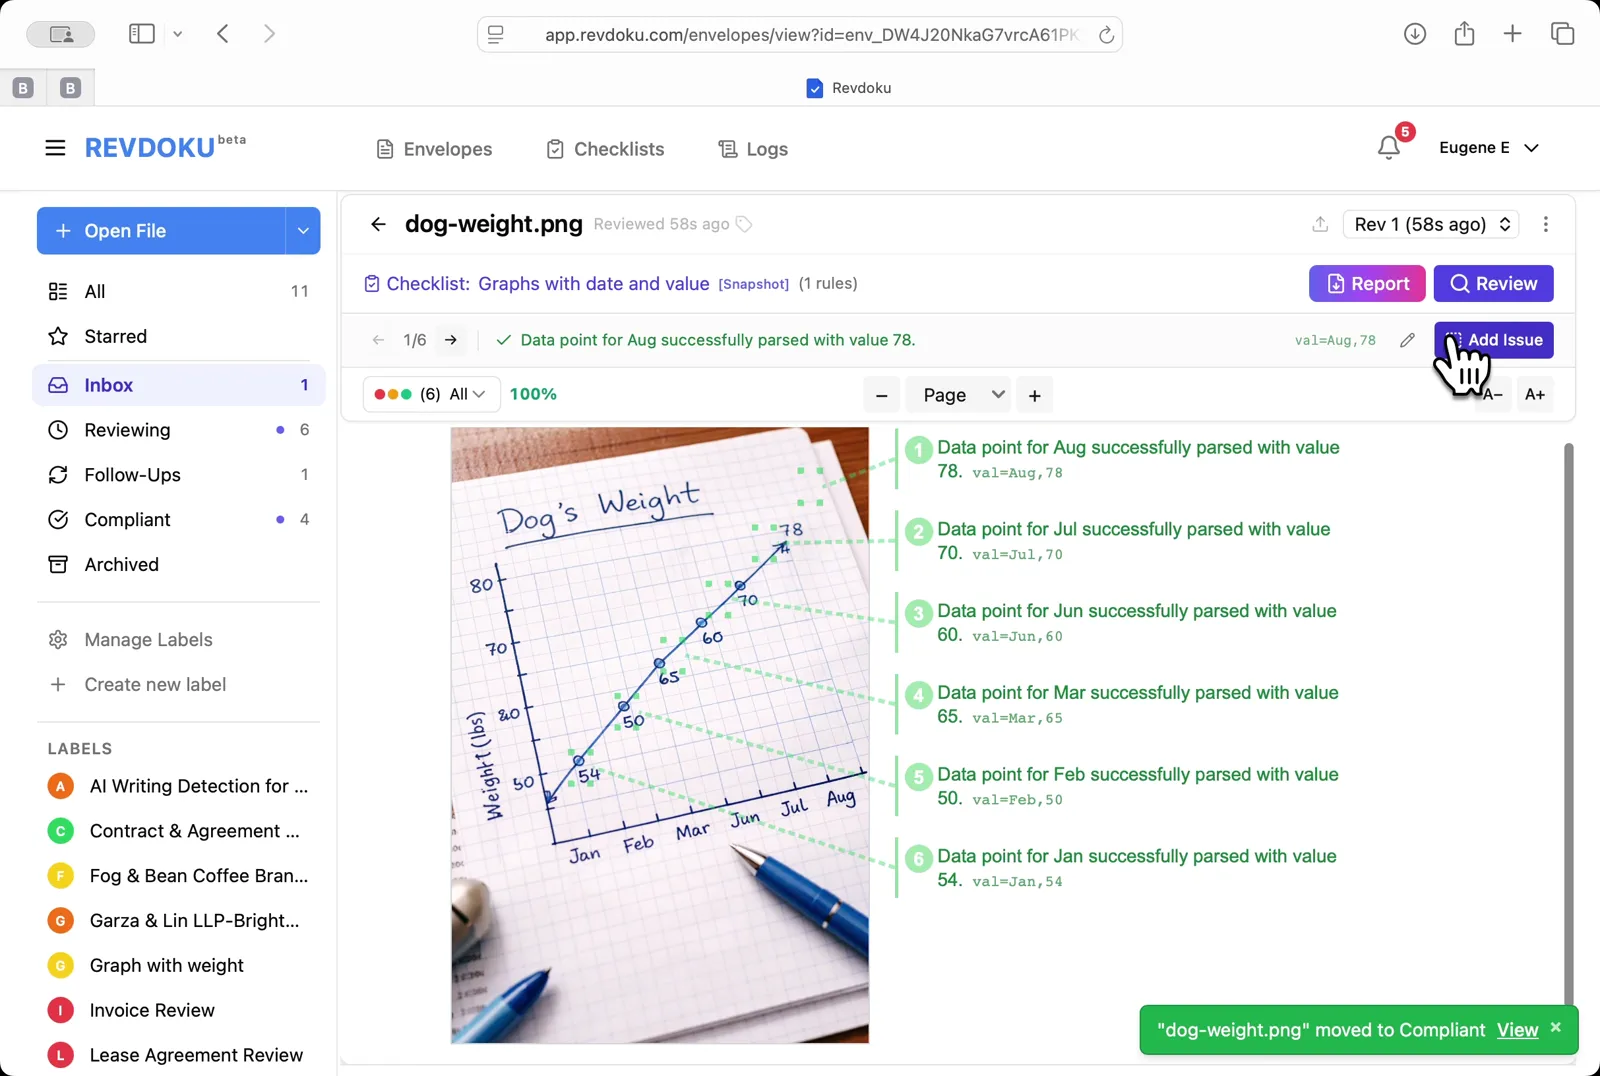
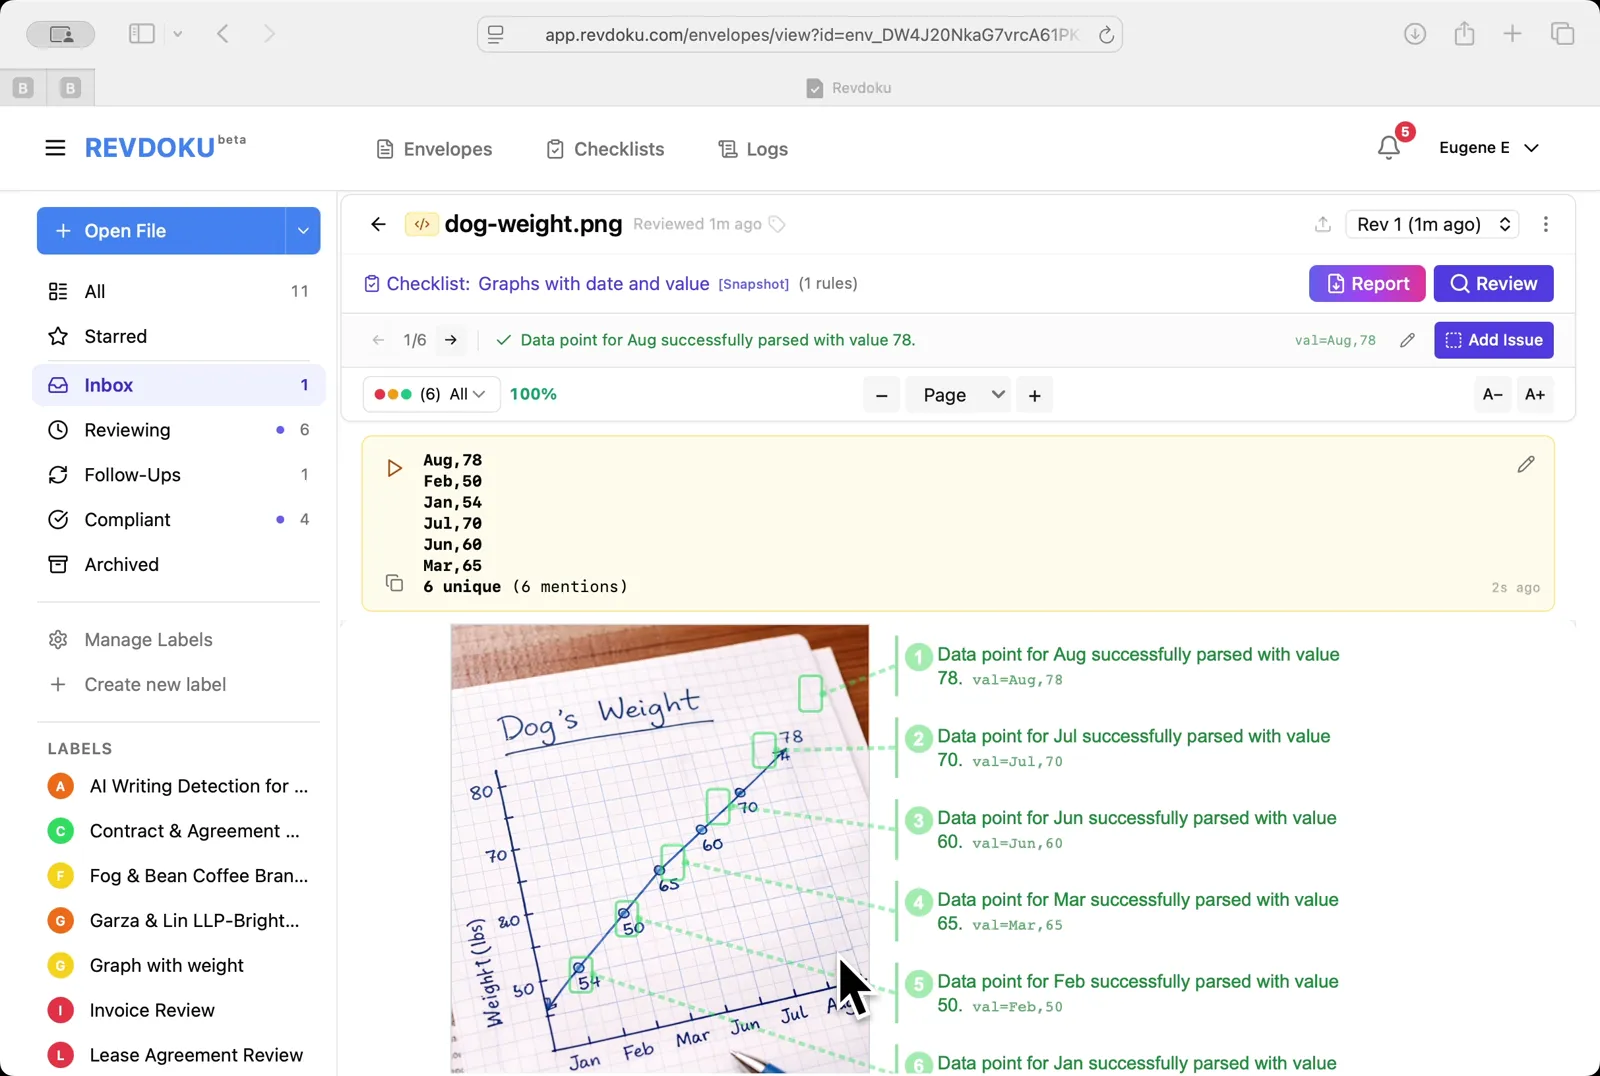
Step 6: Read the extracted points.
Read the extracted points. Every monthly point is annotated on the right with its parsed value, for example val:Aug,78.
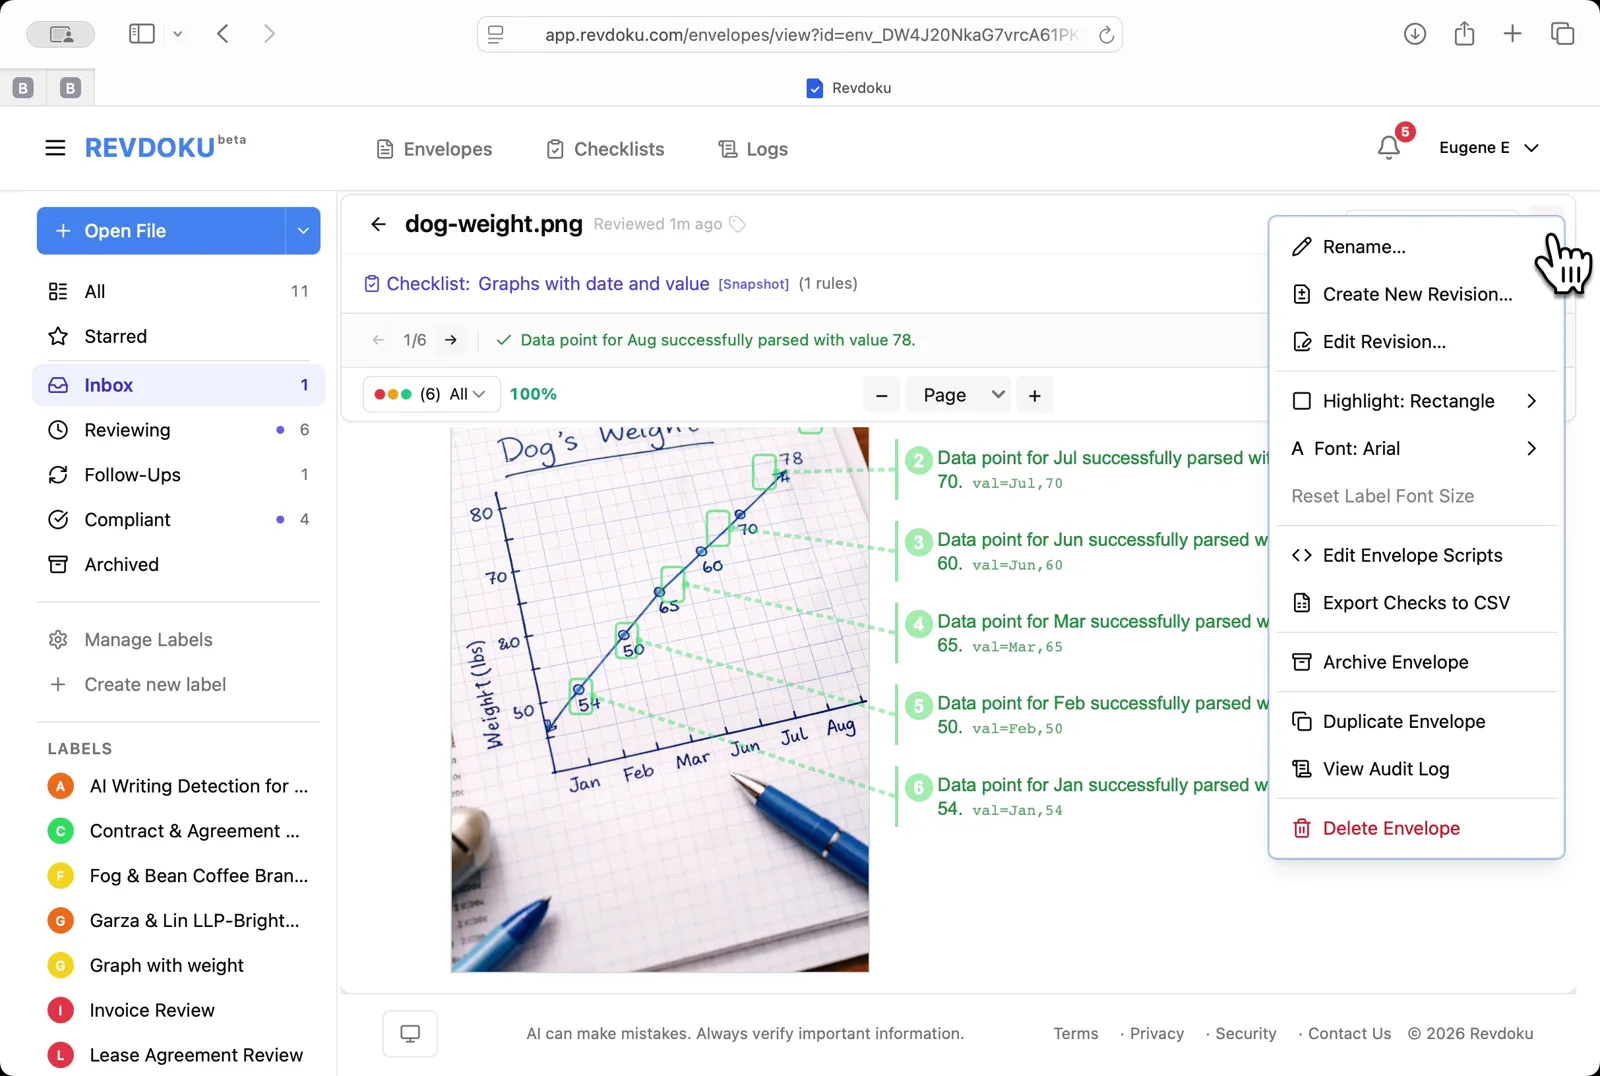
Step 7: Open the envelope menu.
Open the envelope menu. Pick Edit Envelope Scripts to add a script that rolls up the extracted values.
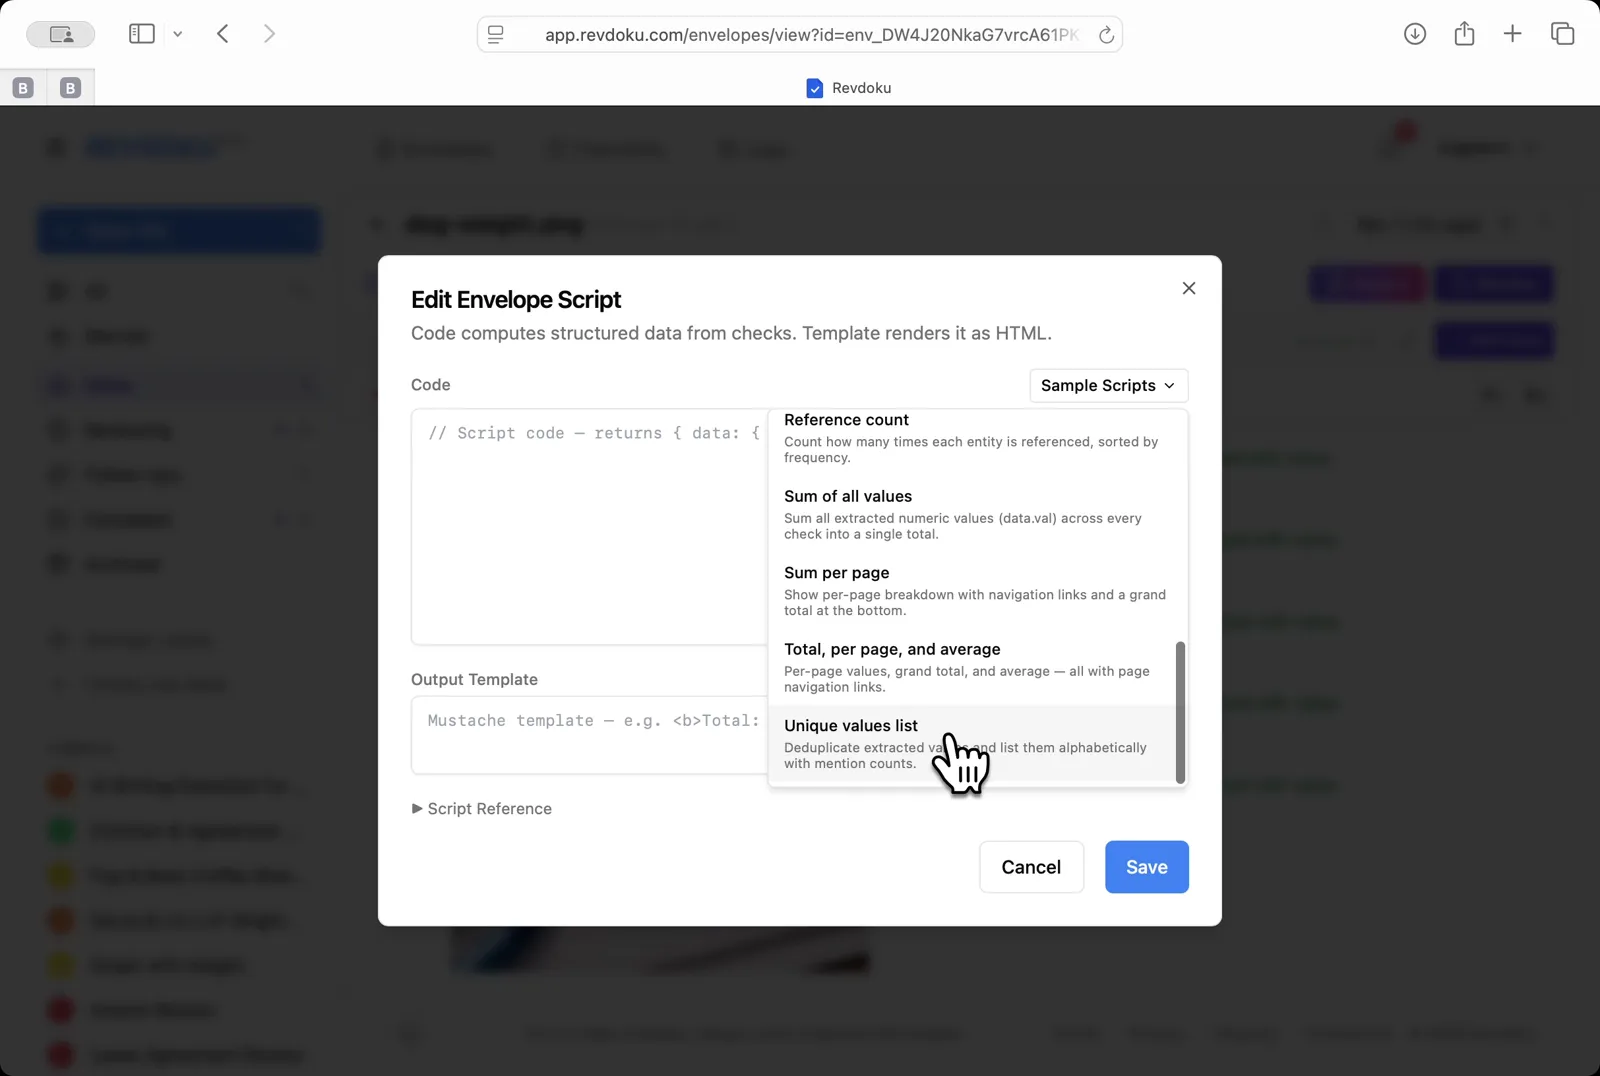
Step 8: Insert a sample script.
Insert a sample script. From the Sample Scripts dropdown, pick Unique values list to deduplicate and alphabetize the points.
Step 9: Read the rolled-up values.
Read the rolled-up values. A yellow summary card lists the 6 unique points (Aug,78 · Feb,58 · Jan,54 · Jul,70 · Jun,60 · Mar,65) above the original chart.
Conclusion
In this tutorial it was demonstrated how to use Revdoku for extracting data from a hand-drawn chart. The following steps were shown:
- Open the Envelopes inbox
- Upload the chart
- Open the chart
- Pick the chart-reading checklist
- Run the review
- Read the extracted points
- Open the envelope menu
- Insert a sample script
- Read the rolled-up values
What You Learned
This case showed how Revdoku can take a document, apply a structured checklist, and surface specific findings — all in under a minute. No manual line-by-line reading required.
Disclosure: Sample documents in this use case were generated using AI and contain intentional errors for demonstration purposes. All names, companies, and details are fictional.
Related Articles
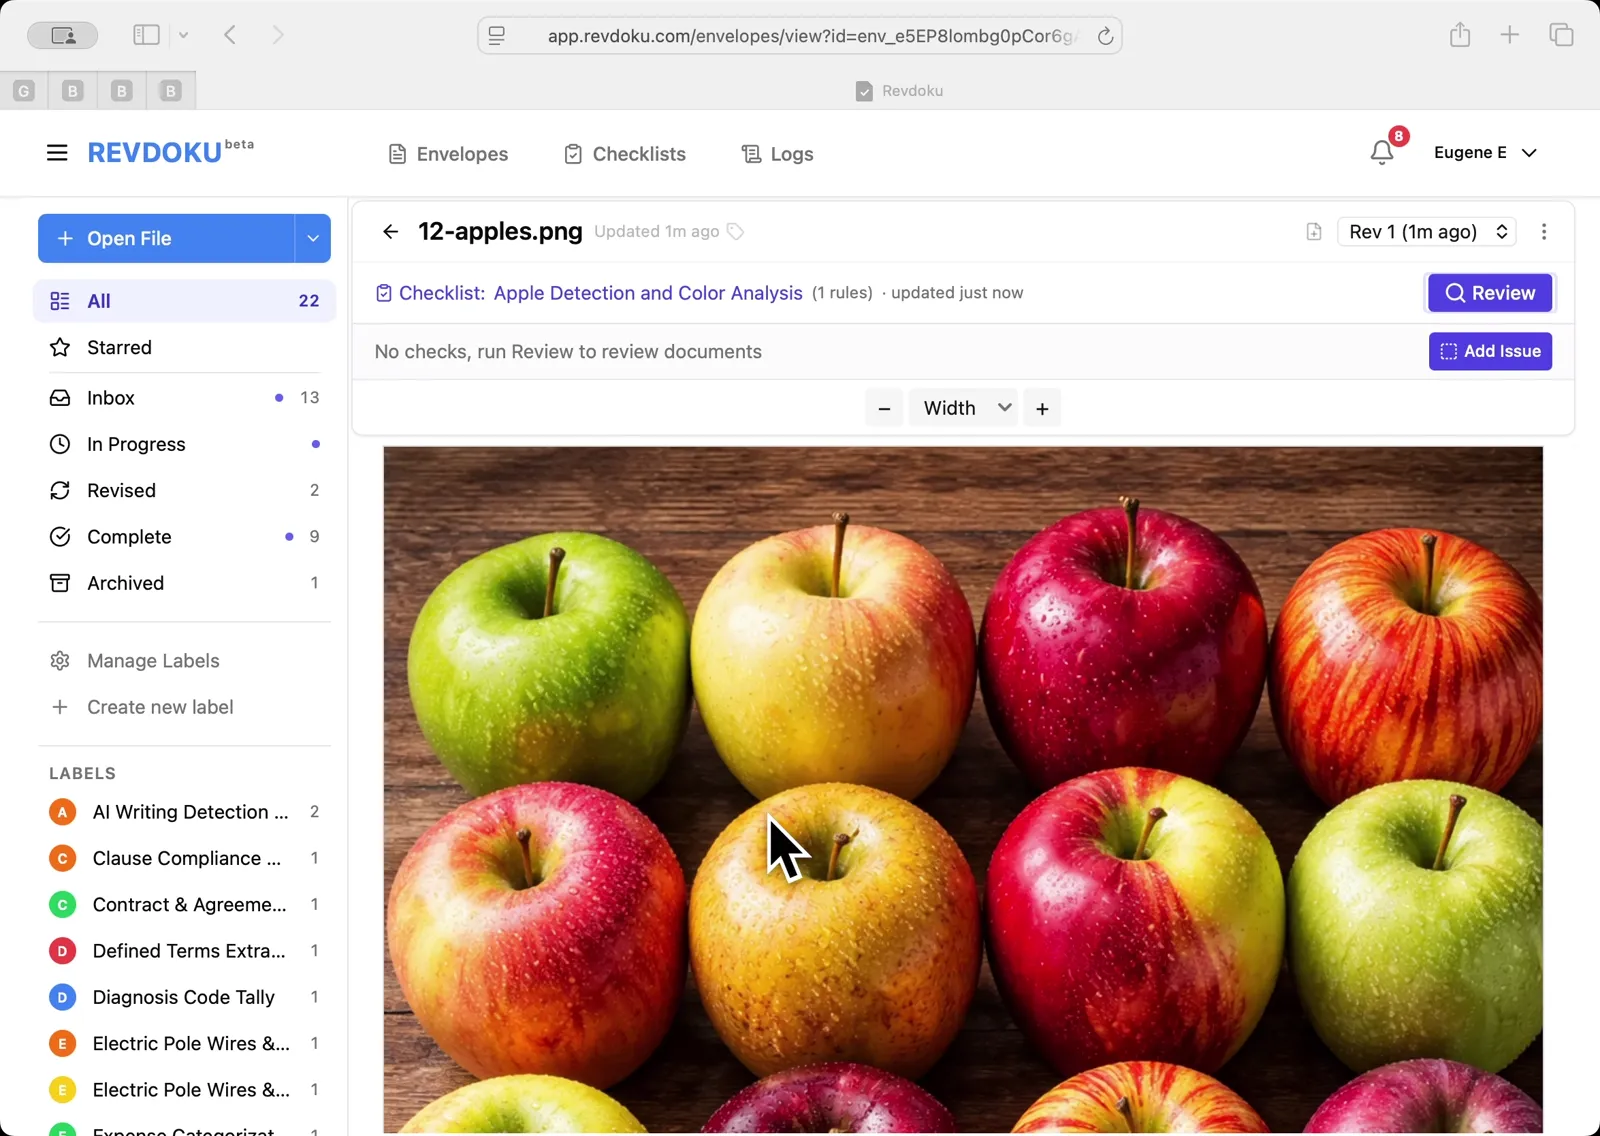
Count Unique Apple Colors in a Photo with Revdoku
Detects all 12 apples in a top-down photo and tags each by dominant color: 4 variegated, 3 red, 3 yellow, 2 green. Group-and-sum script totals 12.
Count Candies by Color in a Photo with Revdoku
Counts a pile of M&M-style candies by color: 7 checks pass at 100%, totaling 113 candies. Group-and-sum script aggregates per-color counts.

Audit a Shareholder Letter for Disclosure Completeness with Revdoku
Generate a document-quality checklist from a single-line prompt with Revdoku, run it against a Letter to Shareholders from a public company, and read the per-rule pass/fail audit report.