Publish Interactive Charts icon

Publish Interactive Charts

Share live chart dashboards and data visualizations with clients and stakeholders from one stable link.

Publish Interactive Charts

Interactive charts often start as a generated HTML page plus CSV or JSON data. Revdoku can publish that folder so the chart becomes a live dashboard.
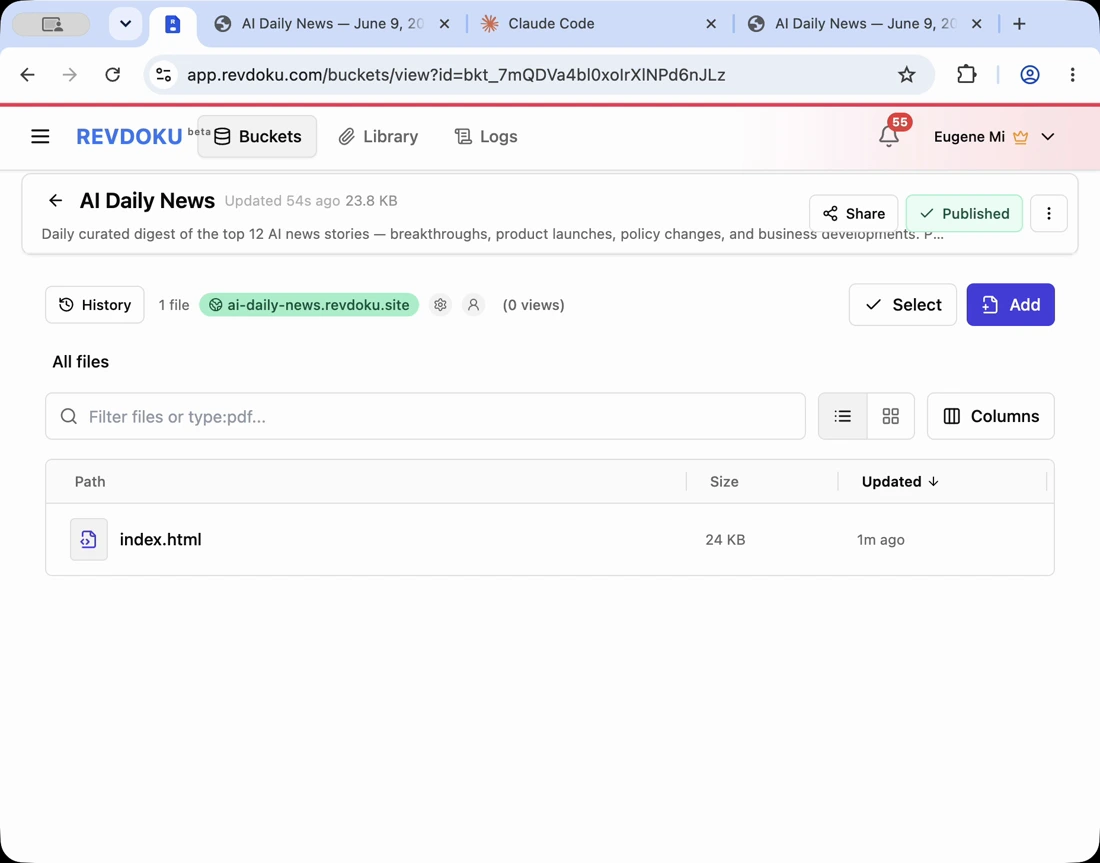
An AI-built site published to a live Revdoku URL

1. Keep chart data with the page

Store the chart HTML, JavaScript, CSV, JSON, and images in one folder so future AI edits can update everything together.
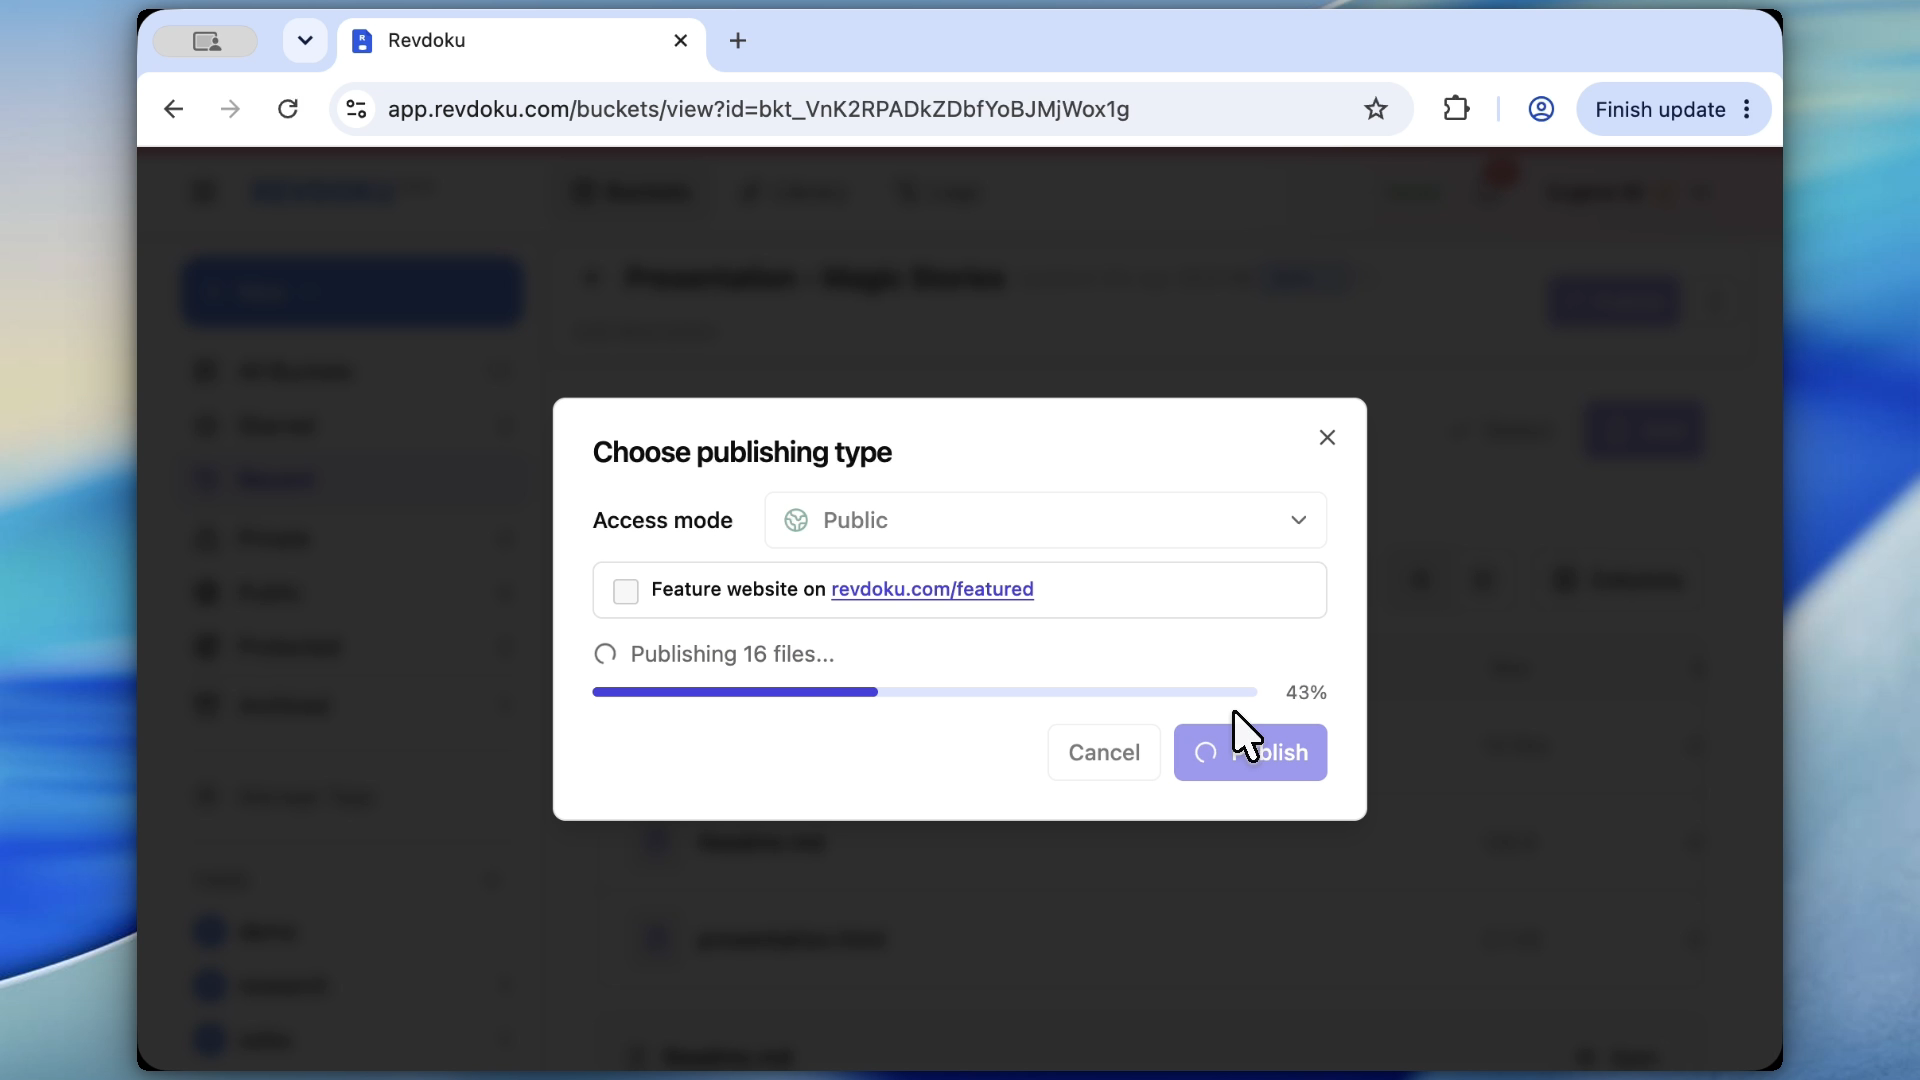
Publish chart site

2. Publish the visualization

Publish the folder and test the live chart, including filters, tooltips, mobile layout, and data loading.
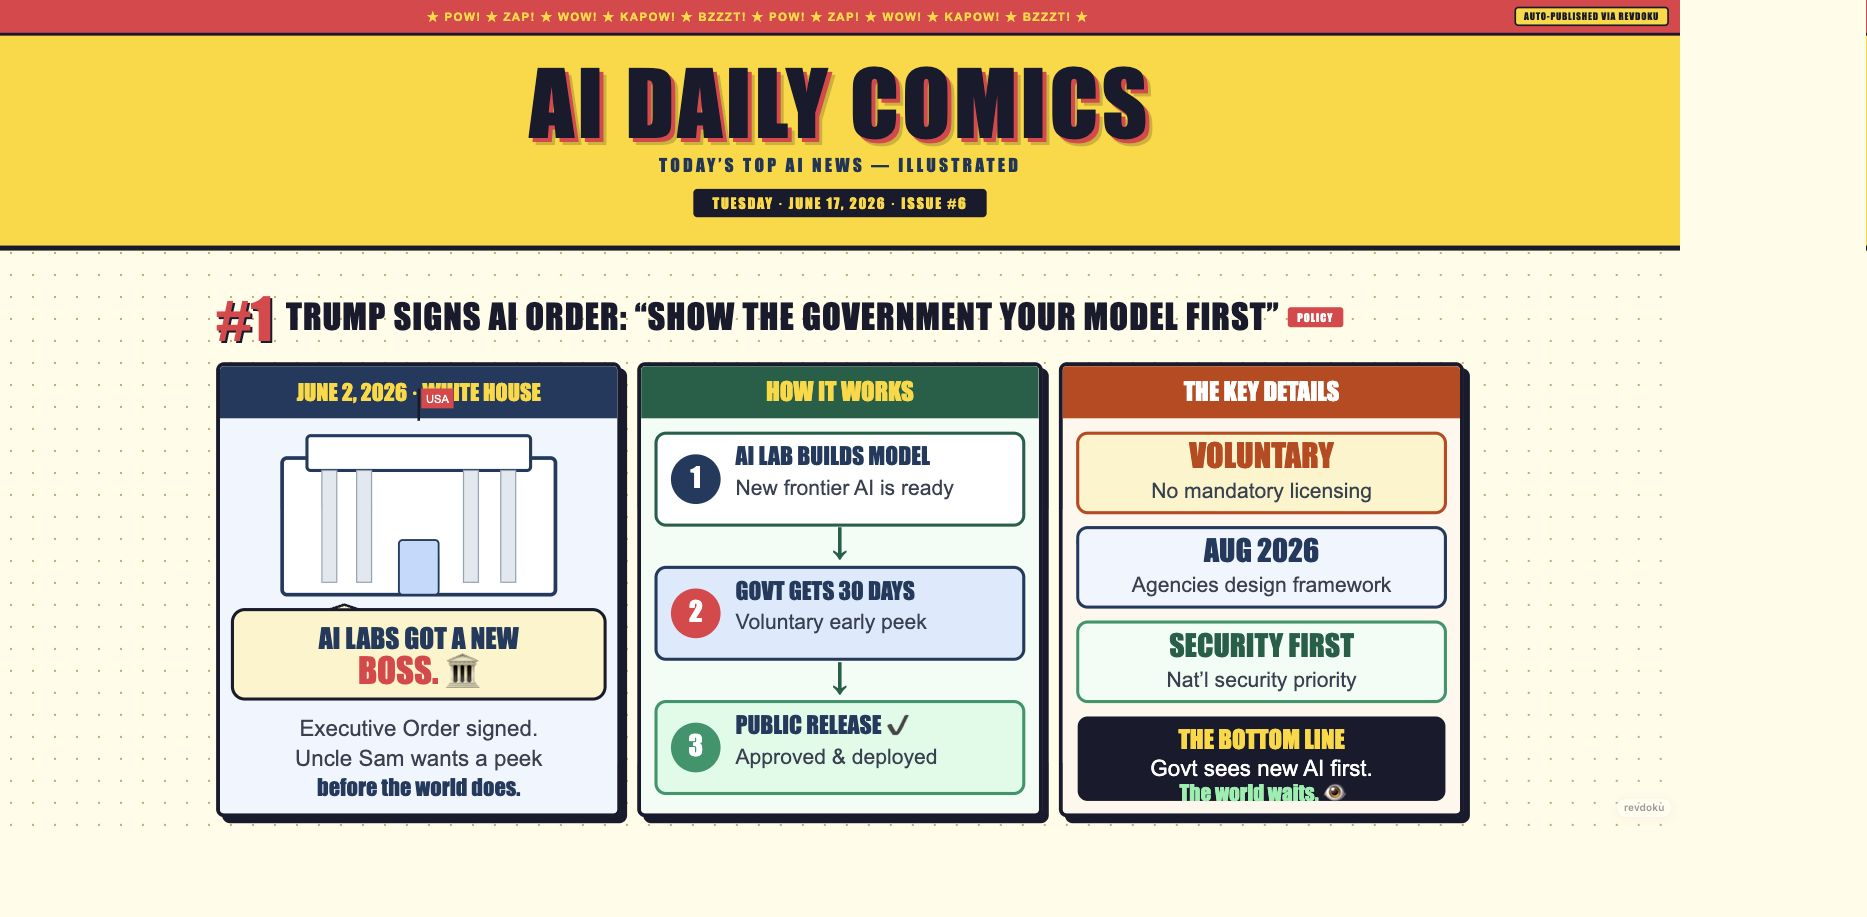
Live chart page

3. Track dashboard usage

Analytics show paths, referrers, missing URLs, and bot activity.
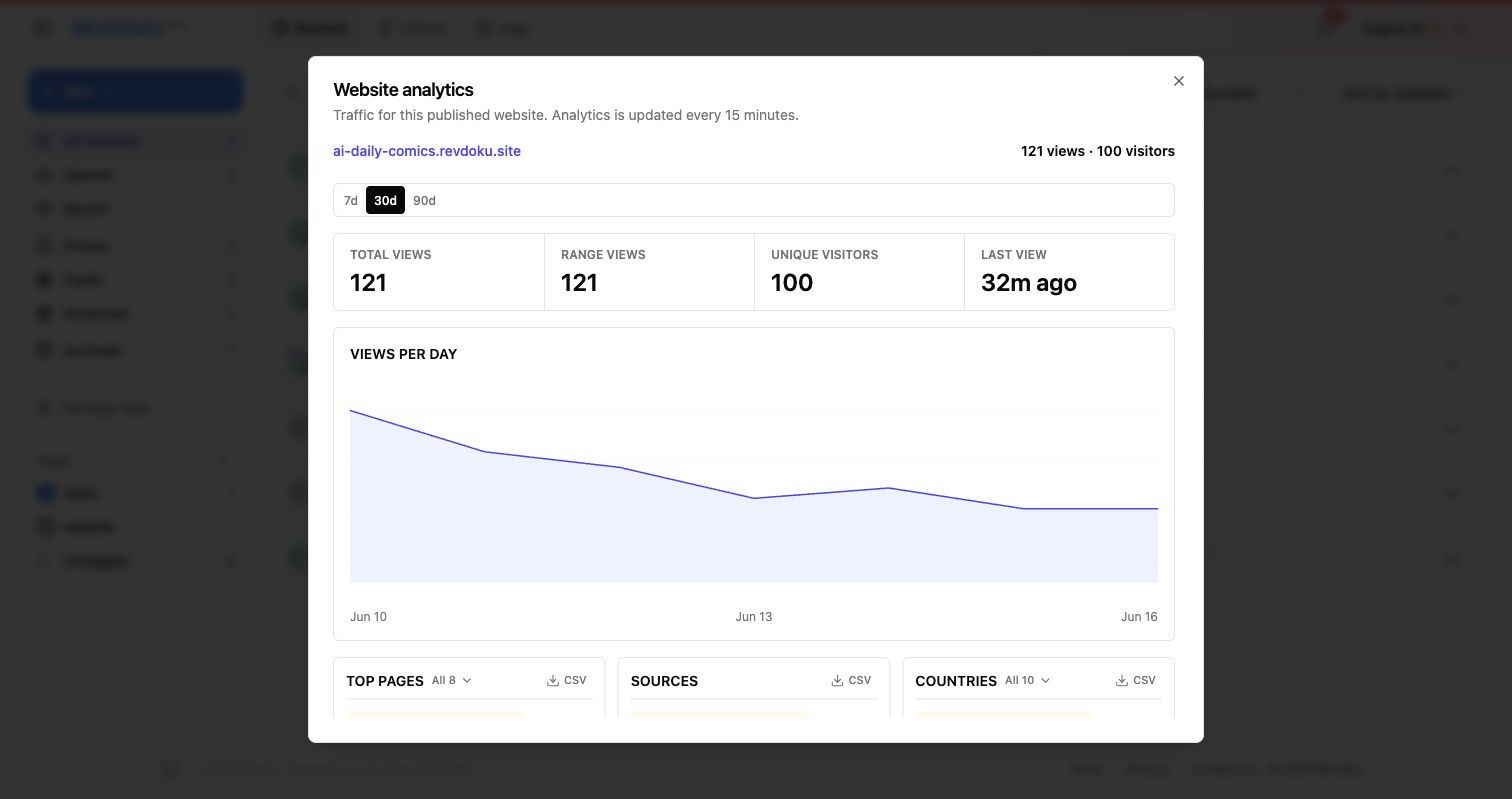
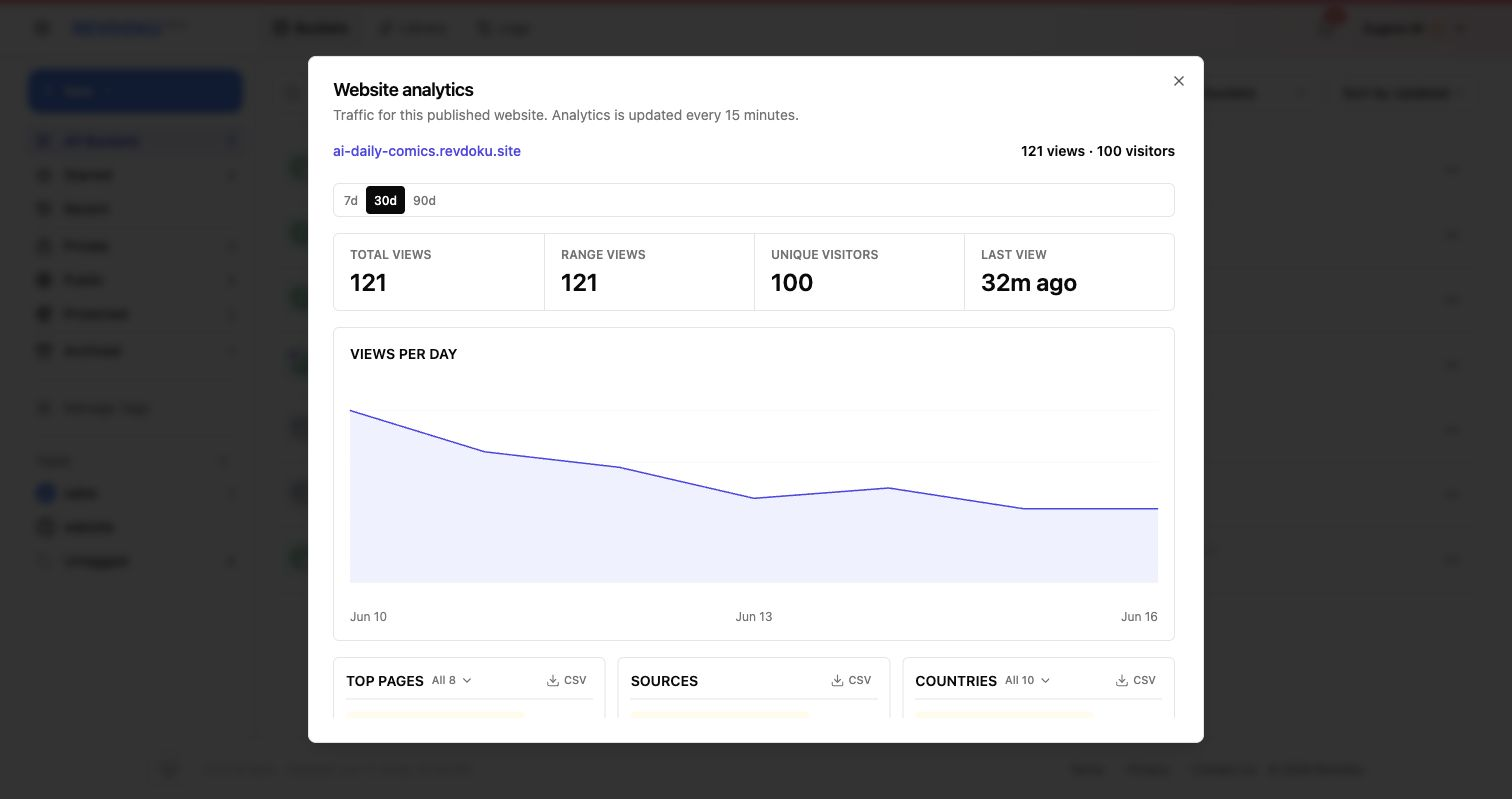
Chart path analytics

Bots and 404 analytics

Takeaway

Use Revdoku when an AI-generated chart or dashboard needs a live URL without becoming a full software deployment project.

Tags

Browse all tags

Show 30 more tags

Just ask to “publish to Revdoku” to publish your as a fast and secure website

from your Codex, Claude or another AI apppublish files or folders

Paste this into your AI app.

Free · Public or protected · Visitor analytics · Forms and email alerts Building websites for clients? Explore Revdoku for agencies